Exploring Biomarker Profiles in the Screening of Sickle Cell Nephropathy
Sickle cell nephropathy is a major complication of sickle cell disease (SCD), leading to health and economic burdens. Early detection is important to prevent irreversible damage, however, conventional biomarkers often lack sensitivity for detecting early-stage nephropathy. This study aims to identify biomarker profiles across the most common SCD phenotypes (hemolysis-dominant and vaso-occlusive-dominant) to enhance early diagnosis.
This cross-sectional study included SCD patients from the Radboud Iron Biobank, enrolled during routine follow-up visits. Patients were categorized by predominant phenotype for HbSS and HbSβ0 genotypes: hemolysis-dominant or vaso-occlusive dominant, and HbSC/HbSD genotypes. Urine and blood biomarkers were assessed during routine visits, with no signs of inflammation or crisis.
Glomerular markers included urinary albumin, total protein, and cystatin C; tubular markers included α1-microglobulin (α1MG), kidney injury molecule-1 (KIM-1), neutrophil gelatinase-associated lipocalin (NGAL), and urine osmolality. Vascular markers included soluble fms-like tyrosine kinase-1 (sFlt-1) and endothelin-1 (ET-1). Clinical data were extracted from electronic records, and informed consent was obtained from all participants.
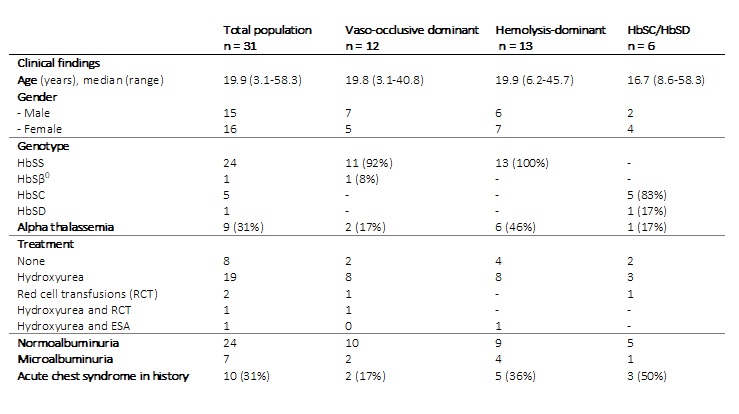
Thirty-one patients (median age 20.4 years, range 3.1-58.3) were included: 12 in the vaso-occlusive dominant group, 13 in the hemolysis-dominant group, and 6 in the HbSC/HbSD-group. Most patients (n=21) were receiving hydroxyurea. Seven adults (23%) had microalbuminuria (range 3.7-12.0 mg/mmol) (Table 1). Serum creatinine and α1-microglobulin-to-creatinine ratio (α1MGCR) were significantly higher in albuminuric patients.
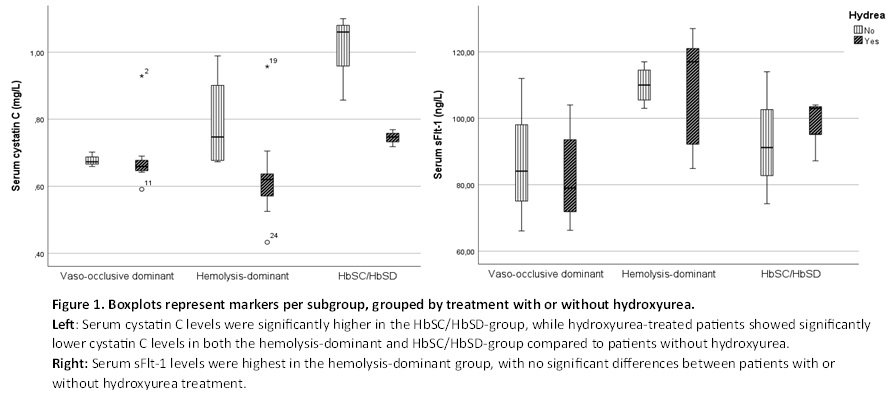
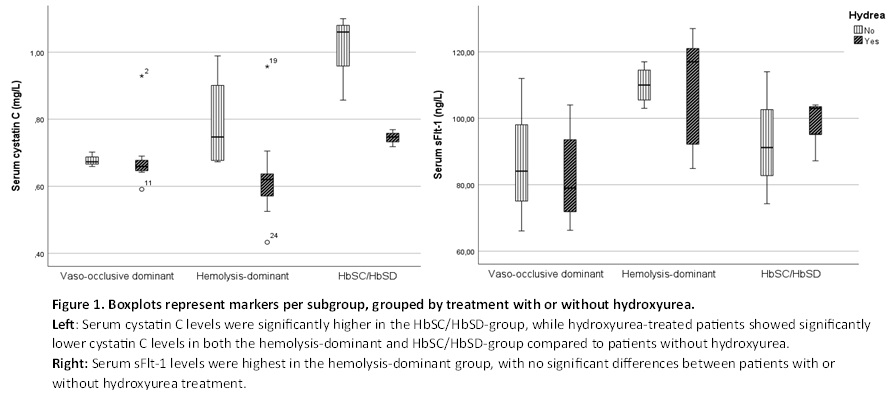
Serum cystatin C levels were highest in the HbSC/HbSD-group and did not vary with age or albuminuria status (Figure 1). Albumin-to-creatinine ratio (ACR) and serum creatinine were similar across subphenotypes (Table 2). Hydroxyurea treatment was associated with lower cystatin C in the HbSC/HbSD and hemolysis-dominant groups but not in the vaso-occlusive dominant group (Figure 1).
The tubular markers α1MG and KIM-1 showed no significant differences by subphenotype or hydroxyurea use, although there was a trend toward lower levels with hydroxyurea. Results for NGAL and KIM-1 will follow.
This exploratory study revealed that cystatin C-levels were highest in the HbSC/HbSD-group, with significantly lower levels in hydroxyurea-treated patients in both the HbSC/HbSD- and hemolysis-dominant groups, suggesting a potentially shared inflammatory pathway. Higher sFlt-1 levels in the hemolytic-dominant group indicated hemolysis-associated endothelial damage. The novel biomarkers showed no correlation with ACR, except for α1MGCR.
Further research with larger sample sizes is needed to validate these findings and explore the underlying biological processes, potentially leading to more targeted treatment strategies.


